- For patients and visitors
- Quality, safety and care
- Patient feedback
Patient feedback
St John of God Health Care measures and reviews patient experience and satisfaction. We encourage caregivers to seek feedback from our patients, their families and carers.
We use patient feedback to improve personalised care across our patients' hospital stay.
What you can do
- Respond to the feedback surveys we send out after you visit our hospitals and services.
- Tell a caregiver if you ever feel unclear, unsure, unprepared or unhappy with your care – this allows us to fix problems as soon as possible.
- Make a complaint if you remain unhappy – this will not impact your care.
- Learn about your rights as a health care consumer – the Australian Charter of Healthcare Rights explains what you should expect at any Australian hospital.
What St John of God Health Care does
- We actively monitor all responses we receive through our surveys and other feedback channels.
- We contact patients and family members when we get negative feedback to understand and learn from concerns.
- We have strict procedures for addressing formal complaints.
- We actively seek out patient feedback through multiple channels including our website, hospital pamphlets, drop boxes and dedicated customer liaison officers.
How we measure feedback
Some of the ways we measure patient feedback are explained below.
Australian Hospital Patient Experience Question Set (AHPEQS)
The Australian Hospital Patient Experience Question Set (AHPEQS) was developed by the Australian Commission on Safety and Quality in Health Care (ACSQHC).
AHPEQS uses 12 questions to assess the quality of a patient's experience during a hospital stay.
If you would like more information on AHPEQS, visit the Australian Commission on Safety and Quality in Health Care website.
Net Promoter Score (NPS)
Net Promoter Score (NPS) is another way we measure patient satisfaction.
NPS measures consumer loyalty by gauging how willing a person is to recommend our hospitals to others.
St John of God Geelong Hospital's patient feedback data
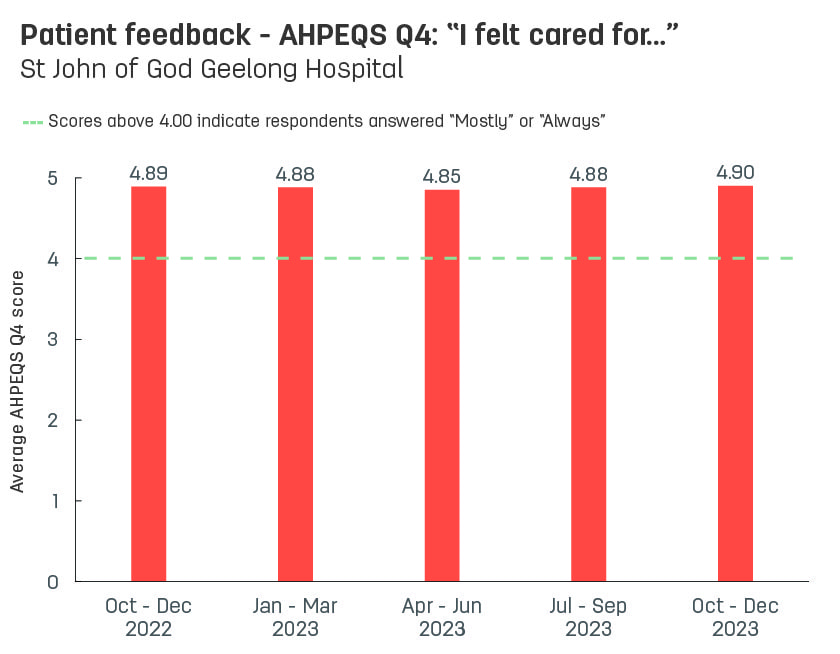
We received a total of 8,774 survey responses across all the quarters displayed in this graph.
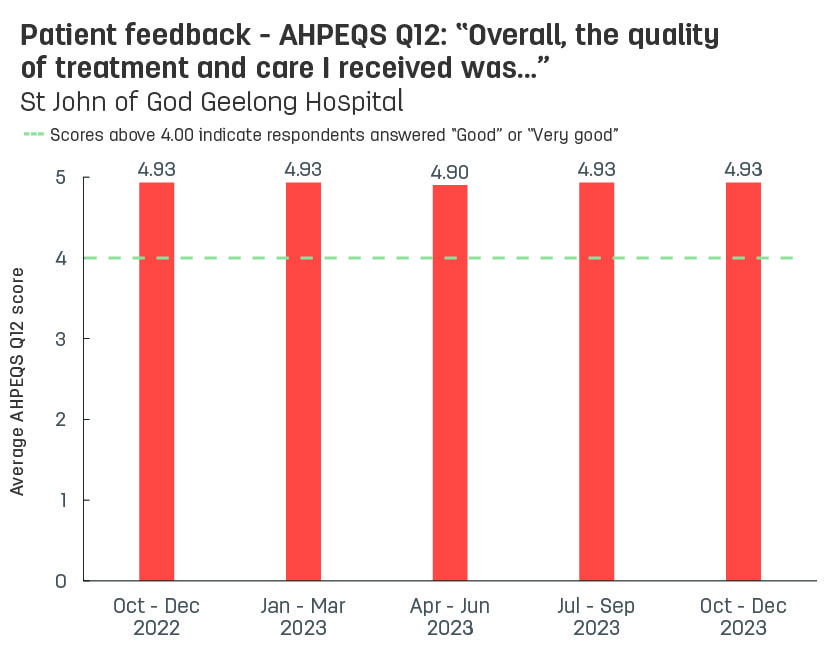
We received a total of 8,616 survey responses across all the quarters displayed in this graph.
The AHPEQS question is displayed at the top of the graph.
Patients choose an option that best aligns with their experience. This is converted to a score of one to five.
AHPEQS question 4 options are scored as:
- Always = 5 out of 5
- Mostly = 4 out of 5
- Sometimes = 3 out of 5
- Rarely = 2 out of 5
- Never = 1 out of 5
AHPEQS question 12 options are scored as:
- Very good = 5 out of 5
- Good = 4 out of 5
- Average = 3 out of 5
- Poor = 2 out of 5
- Very poor = 1 out of 5
The hospital's average AHPEQS score is displayed with the orange bar.
Results are displayed in three-month intervals. These time periods are noted across the bottom of the graph.
The highest possible score the hospital can achieve is 5.00 and the lowest is 1.00.
The higher the score the better.
St John of God Geelong Hospital's Net Promoter Score
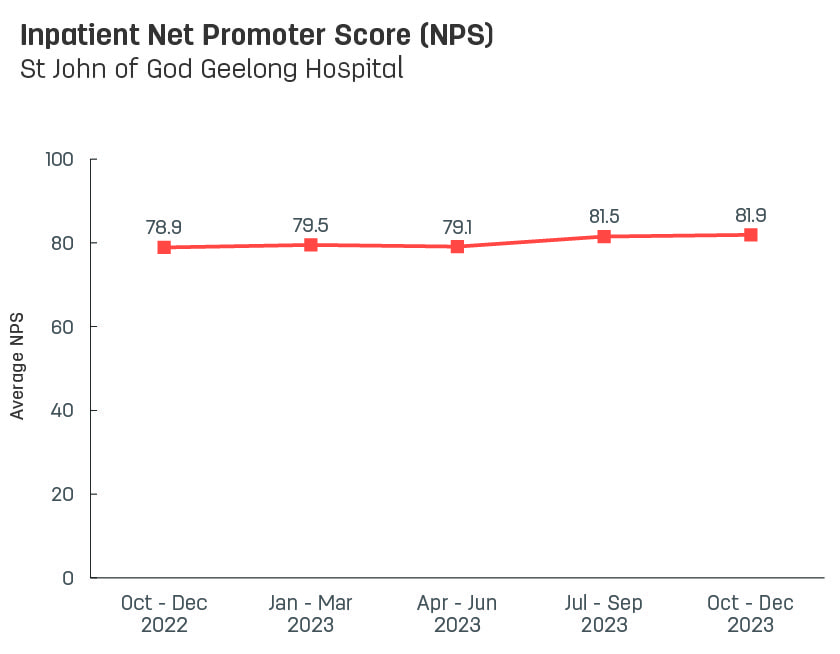
We received a total of 11,361 survey responses across all the quarters displayed in this graph.
The hospital's average Net Promoter Score (NPS) is displayed with the orange line.
Results are displayed in three-month intervals. These time periods are noted across the bottom of the graph.
We ask our inpatients 'how likely are you to recommend this hospital to a family member or friend?'
Consumers choose a rating from zero (not at all likely) to 10 (extremely likely).
A score of nine or 10 is known as 'promoter' feedback, and is a positive result for any St John of God Health Care hospital or service. A score of six or less is classified as 'detractor' feedback, and is viewed as an opportunity to improve our services.
Net Promoter Score (NPS) is calculated from the percentage of promoters (positive feedback), minus the percentage of detractors (negative feedback). This gives each hospital a score between -100 and 100.
St John of God Health Care acknowledges the use of the Net Promoter Score (NPS). Net Promoter Score and NPS are registered trademarks of Bain & Company, Inc., Satmetrix Systems, Inc., and Fred Reichheld.
The highest possible score an organisation can achieve is 100. The higher the score the better.
A hospital score of 60 or more is considered 'good' and a score over 70 is a very strong result.
Our quality and safety activities